
Table of Contents
- What Smart Air Quality Monitors Measure
- Home Air Quality Monitor Accuracy: What You Should Know
- Where to Place an Air Quality Monitor for Best Results
- CO2 Monitor for Home: Why It Matters
- Air Quality Monitor for Bedroom: Tracking Sleep Environment Health
- Smart Home Integration and Real-Time Alerts
- Choosing the Right Monitor: Key Features to Compare
- Improving Indoor Air Quality Beyond Monitoring
- Conclusion
- Frequently Asked Questions
Last Updated: October 10, 2026
What Smart Air Quality Monitors Measure
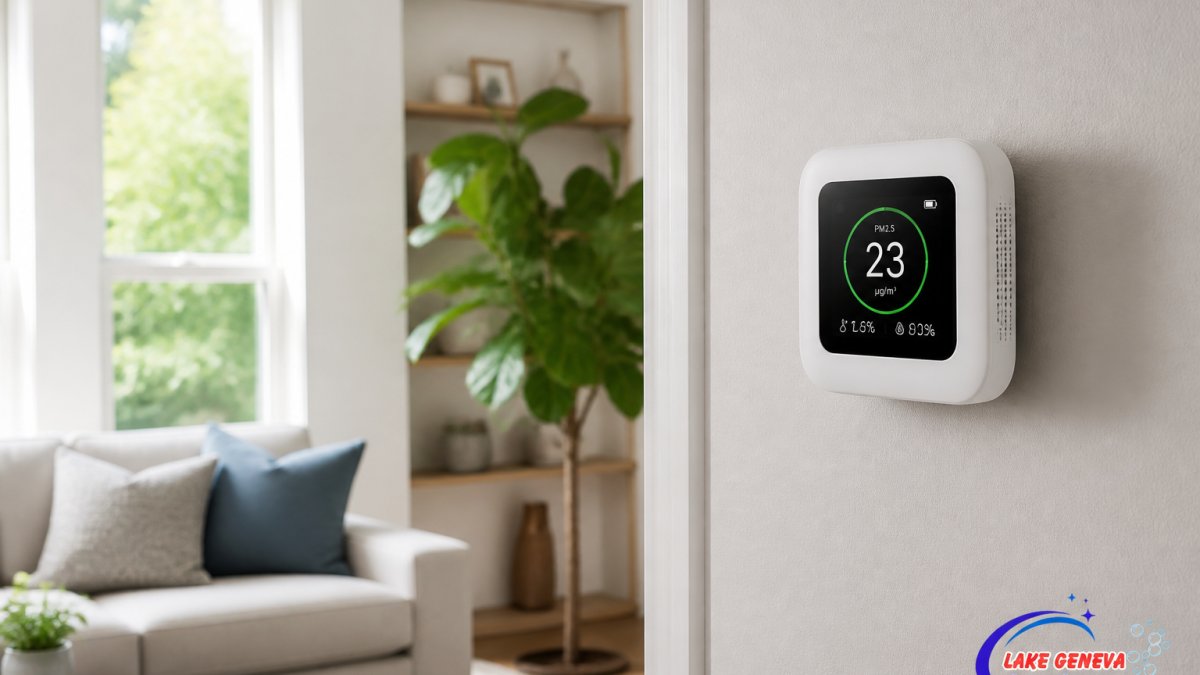
A smart air quality monitor is a connected device that measures indoor pollutants and environmental factors in real time, displaying readings on a screen or mobile app. These monitors track multiple parameters simultaneously, giving you a complete picture of what you’re breathing inside your home.
Understanding what these devices actually measure is the first step toward better indoor air quality. Most people assume all monitors do the same thing. They don’t. Different sensors detect different threats, and knowing which ones matter for your space makes a real difference.
Particulate Matter: PM2.5 and PM10
Particulate matter comes in different sizes, and size determines where particles lodge in your lungs. PM10 refers to particles 10 micrometers or smaller, dust, pollen, and mold spores that settle in your upper airways. PM2.5 is far smaller and far more dangerous: these fine particles penetrate deep into lung tissue and can enter the bloodstream.
Most home air quality monitors focus on PM2.5 because it poses the greater health risk. Pet owners, allergy sufferers, and anyone living near traffic or construction sites should prioritize monitors that track PM2.5 levels. The readings help you know when to close windows, run an air purifier, or take other steps to reduce exposure.
Carbon Dioxide and Volatile Organic Compounds
CO2 levels indicate ventilation quality. A well-ventilated room maintains CO2 around 400 ppm (parts per million). When levels climb above 1,000 ppm, your space needs fresh air. High CO2 doesn’t directly poison you, but it signals stale air and reduced oxygen availability, factors linked to fatigue and reduced cognitive function.
Volatile organic compounds (VOCs) come from paints, cleaning products, furniture off-gassing, and other household sources. Many smart monitors measure total VOCs (TVOCs) rather than individual compounds. A TVOC reading tells you whether your indoor chemical load is elevated, though it doesn’t pinpoint the source.
Temperature, Humidity, and Air Pressure
Temperature and humidity affect both comfort and health. Humidity below 30% dries out airways and skin; above 60% encourages mold and dust mites. Smart monitors track these variables so you can adjust humidifiers or dehumidifiers as needed. Some models also measure air pressure, useful for people sensitive to barometric changes.
Home Air Quality Monitor Accuracy: What You Should Know
Not all sensors are equally reliable. Budget monitors often show wide variance between readings taken seconds apart. Higher-end devices use more stable sensors and better calibration, but even premium monitors have limits.
The biggest accuracy issue stems from sensor drift, the tendency for readings to shift over time without actual air quality changes. A monitor might read PM2.5 at 18 µg/m³ one minute and 22 µg/m³ the next, with no actual change in your home’s air. This noise makes it hard to distinguish real pollution events from sensor fluctuation. Dust accumulation on sensors also degrades accuracy over weeks and months. Many manufacturers recommend cleaning sensors every few months and recalibrating annually, a step many homeowners skip, allowing accuracy to degrade silently.
Real-world conditions stress sensors further. Temperature swings (common in Lake Geneva homes during spring and fall) cause sensor drift. Humidity fluctuations affect both particulate and chemical sensors. A monitor calibrated in winter may read high by summer as temperature compensation fails. Budget models lack temperature and humidity compensation; premium models include it, which is why they hold accuracy across seasonal shifts.
How to evaluate sensor accuracy when shopping:
Look for monitors that publish measurement ranges or confidence intervals. A monitor claiming “PM2.5: 15 µg/m³” with no margin of error is either using poor sensors or hiding uncertainty. Honest manufacturers state something like “PM2.5: 15 ±2 µg/m³” or “±10% of reading.” This transparency tells you whether a reading reflects a real change or sensor noise. If two monitors show different PM2.5 readings in the same room, the difference might be within both devices’ accuracy range, not a sign one is broken.
Sensor type matters. Optical particle counters (used in most home monitors) count particles by size but can be fooled by dust on the lens. Electrochemical CO2 sensors drift over time and need annual calibration. VOC sensors vary wildly in what they detect; some measure only a few compounds while others claim broad coverage. Check the manufacturer’s specification sheet, not just the marketing copy. If they don’t publish sensor specs, that’s a red flag.
Testing a monitor’s accuracy yourself:
Place two monitors side by side in the same room for 24 hours. They won’t read identically, but readings should stay within 10-15% of each other for PM2.5 and within 50 ppm for CO2. If one consistently reads much higher or lower, it may have a sensor problem or poor calibration. Over several days, watch whether readings drift in one direction (a sign of sensor drift) or fluctuate randomly (normal noise). Consistent drift suggests the monitor needs cleaning or recalibration.
For homeowners in the Lake Geneva area, where seasonal humidity and temperature shifts are pronounced, choosing a monitor with temperature and humidity compensation helps maintain accuracy year-round. Winter heating drops humidity to 20-30%; summer moisture can spike above 70%. Cheaper sensors lose accuracy in these extremes. Mid-range and premium monitors compensate for these swings, keeping readings stable.
If you’re comparing two monitors and one costs significantly less, check whether it measures the same parameters with similar accuracy specs and sensor types. A cheap monitor that only tracks PM2.5 with ±15% accuracy is not comparable to one measuring PM2.5, CO2, VOCs, temperature, and humidity with ±5% accuracy, even if the price difference seems large.
Where to Place an Air Quality Monitor for Best Results
Location determines whether your monitor gives useful data or misleading readings. Place monitors in the room where you spend the most time, typically a bedroom or living room. Avoid placing them near windows, doors, or air vents, where outdoor air or conditioned air skews readings.
Mounting height matters. Most experts recommend placing monitors at breathing height: roughly 3-5 feet off the ground. This captures air quality where you actually inhale it. Placing a monitor on a high shelf or near the ceiling gives readings unrepresentative of your actual breathing zone.
Keep monitors away from direct sunlight, heat sources, and humidity-prone areas like bathrooms. Sunlight warms sensors and creates false readings. Bathroom humidity spikes don’t reflect your whole-home air quality.
For multi-level homes, consider placing monitors on each floor. Air quality varies between rooms, especially if some have better ventilation than others. A basement or closed bedroom may have very different readings than an open living room.
CO2 Monitor for Home: Why It Matters
CO2 monitoring has become more important since 2020, when research highlighted ventilation as a defense against airborne illness transmission. A CO2 monitor for home serves as a proxy for ventilation adequacy: rising CO2 means air is becoming stale and recirculated.
For people working from home, a CO2 monitor provides actionable feedback. When levels exceed 1,000 ppm, open a window or turn on mechanical ventilation. This simple action improves focus and reduces fatigue. Parents managing children’s bedrooms also benefit, stuffy rooms with high CO2 correlate with poor sleep quality.
The relationship between CO2 and air quality is indirect but real. You can’t see CO2, so a monitor removes guesswork from ventilation decisions. Many smart monitors integrate CO2 tracking alongside particulate and VOC measurements, giving a complete ventilation picture.
Air Quality Monitor for Bedroom: Tracking Sleep Environment Health
Your bedroom’s air quality directly affects sleep quality. High CO2, elevated temperature, or excessive humidity all disrupt sleep cycles. An air quality monitor for bedroom use helps you optimize the sleeping environment.
Many people discover their bedrooms accumulate CO2 overnight if windows stay closed. Morning headaches or grogginess often trace back to poor ventilation rather than sleep duration. A monitor reveals this pattern, prompting simple fixes like cracking a window or using a small ventilation fan.
Humidity control matters too. Dry air irritates airways; humid air promotes dust mites and mold. A bedroom monitor that tracks humidity helps you maintain the 40-60% range optimal for sleep and respiratory health.
Smart Home Integration and Real-Time Alerts
The “smart” in smart air quality monitors means Wi-Fi connectivity and app integration. Real-time alerts notify you when pollution spikes, CO2 exceeds safe levels, or humidity drifts outside your target range. You can check readings from anywhere, not just when standing next to the device.
Many monitors integrate with popular smart home platforms, allowing automation. Set rules like “turn on the air purifier when PM2.5 exceeds 25 µg/m³” or “open smart vents when CO2 hits 1,200 ppm.” This removes the need for manual intervention and keeps conditions optimal without constant monitoring.
Privacy considerations matter. Check whether your chosen monitor stores data locally, on the manufacturer’s servers, or both. Some users prefer local-only storage; others accept cloud storage for the convenience of historical trend analysis.
Before purchasing a smart monitor, verify that it connects to platforms you already use. A monitor that only works with an obscure app ecosystem limits your ability to automate responses or integrate with other smart home devices.
Choosing the Right Monitor: Key Features to Compare
Different monitors excel at different priorities. Some emphasize PM2.5 accuracy for allergy sufferers. Others prioritize CO2 tracking for ventilation management. A few offer comprehensive measurement across all parameters.
Consider your primary concern. Pet owners need strong particulate matter sensors. Home office workers benefit most from CO2 monitoring. Allergy sufferers should prioritize PM2.5 and VOC tracking. Parents managing children’s health may want temperature and humidity features for sleep optimization.
Look for monitors that update readings frequently, ideally every 10 seconds or less. Slow update rates miss pollution spikes. Also check whether the device stores historical data locally or requires cloud access. Local storage gives you a backup if the manufacturer’s servers go down.
| Feature | Why It Matters | Best For |
|---|---|---|
| PM2.5 sensor | Detects fine particles affecting lung health | Allergy sufferers, pet owners |
| CO2 tracking | Indicates ventilation adequacy | Remote workers, sleep quality |
| VOC/TVOC measurement | Identifies chemical off-gassing | New furniture, recent renovations |
| Temperature/humidity | Supports comfort and mold prevention | Sleep optimization, humidity control |
| Real-time app alerts | Notifies you of pollution spikes | Active monitoring, automation setup |
| Local data storage | Preserves history without cloud dependency | Privacy-conscious users |
| Frequent updates | Catches rapid air quality changes | Sensitive individuals |
Improving Indoor Air Quality Beyond Monitoring
A monitor tells you what’s wrong but doesn’t fix it. The real work happens after you see the readings. For homeowners and business owners in the Lake Geneva area, understanding local air quality patterns is essential to choosing the right remediation strategy.
Seasonal air quality challenges in Lake Geneva:
Lake Geneva’s location in southeastern Wisconsin creates distinct seasonal air quality patterns. Spring and fall bring high pollen counts from oak, birch, and ragweed, typically peaking in May and late August through September. Summer brings occasional wildfire smoke from western states, which can spike PM2.5 levels dramatically over 1-3 days. Winter heating creates dry indoor air (humidity often drops to 20-25%), stressing respiratory systems and reducing the effectiveness of air purifiers. Understanding these patterns helps you time interventions and set realistic monitor thresholds.
Spring and fall are critical for PM2.5 management. During high pollen season, outdoor PM2.5 often exceeds 35 µg/m³ on peak days. Keeping windows closed and running mechanical filtration indoors becomes essential. A monitor shows you when outdoor air quality is poor enough to justify keeping windows shut despite the desire for fresh air. Summer wildfire smoke events are unpredictable but severe; a monitor alerts you to close windows and run air purifiers before you notice the haze visually.
Winter heating in Lake Geneva homes creates a different problem: extremely dry indoor air. Forced-air heating systems pull moisture from indoor air, and cold outdoor air contains little moisture to replace it. Humidity often drops below 30%, which dries airways, increases susceptibility to respiratory infection, and reduces the effectiveness of HEPA filtration (dry air causes static discharge that can damage filter media). A monitor that tracks humidity helps you maintain a humidifier, keeping levels in the 40-60% range optimal for health and air purifier performance.
Remediation strategies by season:
Spring (April-May): High pollen, moderate outdoor PM2.5. Run air purifiers with HEPA filters in bedrooms and living spaces. Keep windows closed on high-pollen days (monitor alerts help identify these). Shower and change clothes after outdoor time to avoid tracking pollen indoors. A bedroom monitor helps ensure you’re sleeping in clean air despite outdoor pollen.
Summer (June-August): Lower pollen, occasional wildfire smoke events. Monitor for sudden PM2.5 spikes; when they occur, close windows and run purifiers. Maintain outdoor air quality awareness through your monitor’s readings. If your monitor shows outdoor air is clean, open windows for natural ventilation, this is the season to maximize fresh air exchange.
Fall (September-November): High ragweed pollen (late August through September), then declining pollen, increasing mold spores from leaf litter. Similar strategy to spring: close windows on high-pollen days, run purifiers. A humidity monitor becomes important as heating season approaches; as furnaces turn on, humidity drops rapidly.
Winter (December-March): Low outdoor pollen, very dry indoor air from heating. Focus on humidity control: run humidifiers to maintain 40-60% humidity. This supports respiratory health and air purifier performance. CO2 monitoring becomes critical; closed windows and sealed homes trap CO2. A monitor showing CO2 above 1,000 ppm signals the need to crack a window or run mechanical ventilation, even in cold weather. Some Lake Geneva homes benefit from ERV (energy recovery ventilation) systems that exchange stale indoor air for fresh outdoor air while recovering heating energy, a monitor validates whether such a system is working.
Particulate matter remediation:
For elevated PM2.5, mechanical filtration works. Air purifiers with HEPA filters capture fine particles. Running a purifier in your bedroom during sleep significantly reduces overnight exposure. In the Lake Geneva area, where seasonal pollen and dust are pronounced, this step matters most during spring and fall. Position purifiers in the room where you spend the most time; a monitor in that room shows whether the purifier is effective. If PM2.5 remains high despite running a purifier, check whether the filter is clogged (a sign it needs replacement) or whether outdoor air is leaking in around windows and doors.
Ventilation and CO2 management:
High CO2 requires ventilation. Open windows when outdoor air quality permits. If outdoor pollution is high (wildfire smoke, high pollen), mechanical ventilation systems with filters provide fresh air without admitting pollutants. Many modern homes benefit from ERV systems that exchange indoor and outdoor air while minimizing heating and cooling loss. A CO2 monitor shows whether your ventilation strategy is working; if CO2 stays above 1,000 ppm despite open windows, you may need mechanical ventilation.
VOC reduction and off-gassing:
VOC reduction starts at the source. Choose low-VOC paints and finishes for renovations. Avoid synthetic air fresheners and scented products. Allow new furniture to off-gas in well-ventilated spaces (a garage or basement with a window open) before bringing it into main living areas. These steps work faster than trying to filter VOCs after they’ve dispersed throughout your home. A TVOC monitor helps you track whether off-gassing is declining over days and weeks.
Humidity control:
Humidity control uses dehumidifiers (when humidity exceeds 60%) or humidifiers (when it drops below 30%). Maintaining the 40-60% range discourages mold and dust mites while supporting respiratory comfort and air purifier performance. In Lake Geneva’s winter heating season, humidifiers are essential; in summer, dehumidifiers may be needed in basements or poorly ventilated spaces.
Monitoring alone changes nothing. Act on the data: open windows when outdoor air is clean, run purifiers when pollution spikes, adjust humidity seasonally, improve ventilation. The monitor is your feedback tool; your actions, informed by local seasonal patterns, are what actually improve air quality.
Conclusion
Smart air quality monitors give homeowners and business owners in the Lake Geneva area clear visibility into what they’re breathing. Understanding what these devices measure, particulate matter, CO2, VOCs, temperature, and humidity, helps you choose the right monitor for your priorities and interpret readings correctly.
Placement, accuracy expectations, and smart home integration all shape the value you’ll get from a monitor. But the real payoff comes from acting on the data: improving ventilation, running air purifiers when needed, and maintaining humidity levels that support health.
Beyond monitoring, professional carpet cleaning removes one of the largest sources of indoor air pollution: embedded dust, allergens, and contaminants in carpet fibers. Lake Geneva Carpet Cleaning uses truck-mounted hot water extraction technology to eliminate these pollutants deep in carpet padding, the kind of deep cleaning that surface vacuuming can’t achieve. When combined with smart air quality monitoring, professional carpet maintenance creates a comprehensive approach to healthier indoor air. Contact Lake Geneva Carpet Cleaning for a free quote and discover how professional cleaning transforms your home’s air quality.
Frequently Asked Questions
How accurate are indoor air quality monitors?
Smart air quality monitors vary in accuracy depending on sensor quality and calibration. Consumer-grade monitors typically measure particulate matter (PM2.5 and PM10) within 10-15% of reference equipment, while CO2 sensors can drift over time. Accuracy improves when monitors are placed correctly, away from walls and direct sunlight, and calibrated according to manufacturer guidelines. Budget monitors are generally less precise than premium models, but all benefit from regular maintenance and proper positioning for reliable readings.
What should a smart air quality monitor measure?
The best smart air quality monitors track multiple parameters: particulate matter (PM2.5 and PM10), carbon dioxide (CO2), volatile organic compounds (TVOCs), temperature, and humidity. PM2.5 is critical because these fine particles penetrate deep into lungs. CO2 indicates ventilation quality, while TVOCs reveal chemical pollutants from household products. Temperature and humidity help you understand conditions that affect allergens and mold risk. Real-time monitoring with historical data tracking lets you identify patterns and adjust your environment accordingly.
Is a CO2 monitor worth it for a home?
A CO2 monitor for home use is valuable if you’re concerned about ventilation and indoor air quality. High CO2 levels (above 1000 ppm) indicate poor air exchange and can affect concentration and sleep quality. Monitors help you identify when to open windows or adjust HVAC settings. They’re especially useful for bedrooms, home offices, and basements where stagnant air accumulates. Combined with other air quality sensors, a CO2 monitor provides a complete picture of your indoor environment and helps you make informed decisions about ventilation.
Can smart air quality monitors detect mold?
Smart air quality monitors cannot directly detect mold, but they help identify conditions that support mold growth. High humidity levels (above 60%) and poor ventilation (indicated by elevated CO2) create environments where mold thrives. Some monitors track humidity and temperature, which are mold risk indicators. If you suspect mold, a monitor helps you maintain humidity below 50% through ventilation or dehumidification. For actual mold detection, you’ll need visual inspection or professional testing, but air quality monitors are valuable tools for prevention.